很老的笔记,总结一下。
供需求函数
\[\begin{cases} q_t^D &= \alpha_0 + \alpha_1 p_t + u_t\\ q_t^S &= \beta_0 + \beta_1 p_t + v_t\\ q_t^D &= q_t^S\\ \end{cases}\]
这是供需求函数,我们肯定不能直接用\(q_t = \alpha_0 + \alpha_1 p_t + u_t\)去跑回归。 因为我们首先不知道这是代表供给还是需求函数,实际上谁也不是。
\[\begin{cases} q_t &= \alpha_0 + \alpha_1 p_t + u_t \\ q_t &= \beta_0 + \beta_1 p_t + v_t \\ \end{cases}\]
解得:
\[\begin{alignat}{2} p_t &= \frac{\beta_0-\alpha_0}{\beta_1-\alpha_1} + \frac{v_t-u_t}{\beta_1-\alpha_1}\\ p_t &\sim v_t,u_t\\ \end{alignat}\]
我们知道,当\(x\)和\(\mu\)线性相关,\(x\)就是内生了(陈强 2014)。
这个时候我们需要引入 工具变量,假设是天气\(x_t\)。
工具变量的两个条件:
- 在供给方程中,天气影响\(p_t\)的,因此\(Cov(p_t,x_t) \neq 0\)1。
- \(x_t\)和\(u_t,v_t\)都不像相关,天气是外生的,除了自身,不受到其他变量决定。
重新写供给函数
\[\begin{cases} q_t^S &= \beta_0 + \beta_1 p_t + \beta x_t + v_t\\ q_t^S &= \beta_0 + \beta_1 p_t \xleftarrow{\rho > 0} \beta x_t \xrightarrow{\times} v_t\\ \end{cases}\]
所以,
这里涉及到 2SLS
第一步,
\[\begin{alignat}{2} p_t &= \gamma_0 + \gamma_1 x_t + \delta_t\\ p_t &= \hat{p_t}(x_t) + \hat{\delta}_t\\ \end{alignat}\]
第二步,
\[\begin{cases} q_t &= \alpha_0 + \alpha_1 \hat{p_t} + u_t + \alpha_1 (p_t - \hat{p_t}) \\ q_t &= \beta_0 + \beta_1 \hat{p_t} + v_t + \beta_1 (p_t - \hat{p_t}) \\ \end{cases}\]
\[\begin{cases} q_t &= \alpha_0 + \alpha_1 (\hat \gamma_0 + \hat \gamma_1 x_t) + u_t + \alpha_1 (p_t - \hat{p_t}) \\ q_t &= \beta_0 + \beta_1 (\hat \gamma_0 + \hat \gamma_1 x_t) + v_t + \beta_1 (p_t - \hat{p_t}) \\ \end{cases}\]
然后就可以回归了。
矩估计
- 一矩:\(E(x) = \mu\)
- 二矩:\(E(x^2) = Var(x) + E^2(x) = \sigma^2 + \mu^2\)
如果我们假设\(x \sim N(\mu,\sigma)\),有两个未知数,因此我们需要两个假设,\(\mu\)和\(\sigma\),并使用两个方程去估计,就是我们的矩。 通常我们用样本矩来猜测,
\[\begin{cases} \frac{1}{n}\sum_{i=1}^n x_i = \hat \mu\\ \frac{1}{n}\sum_{i=1}^n x_i^2 = \hat{\mu}^2 + \hat{\sigma}^2\\ \end{cases}\]
因此任意的\(f(x)\)都可以叫做矩估计。
这里我们使用第二个假设,
\[\begin{alignat}{2} E(z_i \epsilon_i) &= 0\\ E(z_i (y_i - x_i^{'} \beta)) &= 0\\ E(z_i y_i)&= E(z_i x_i^{'}) \cdot \beta\\ E(z_i x_i^{'})^{-1} E(z_i y_i)&= \beta\\ \end{alignat}\]
我们用样本估计,来估计总体估计!!!
\[\begin{alignat}{2} E(z_i x_i^{'})^{-1} E(z_i y_i)&= \beta\\ \hat \beta &= (\frac{1}{n}\sum_{i=1}^n z_i x_i^{'})^{-1} (\frac{1}{n}\sum_{i=1}^n z_i y_i)\\ \hat \beta &= (z_i x_i^{'})^{-1}(z_i y_i)\\ \end{alignat}\]
样本矩除了\(E(\beta)\),还有\(Var(\beta)\)要估计。
\[\begin{alignat}{2} \hat \beta - \beta &= (z_i x_i^{'})^{-1}z_i(x^{'}\beta+\epsilon) - \beta\\ \hat \beta - \beta &= (z_i x_i^{'})^{-1}z_ix^{'}\beta+(z_i x_i^{'})^{-1}z_i \epsilon - \beta\\ \hat \beta - \beta &= \beta+(z_i x_i^{'})^{-1}z_i \epsilon - \beta\\ \hat \beta - \beta &= (z_i x_i^{'})^{-1}z_i \epsilon\\ \hat \beta - \beta &= (\frac{1}{n}\sum_{i=1}^n z_i x_i^{'})^{-1}(\frac{1}{n}\sum_{i=1}^n z_i \epsilon_i)\\ \hat \beta - \beta &= S_{ZX}^{-1} \bar g\\ \end{alignat}\]
这里假设\(S_{ZX}^{-1} = (\frac{1}{n}\sum_{i=1}^n z_i x_i^{'})^{-1}\)、 \(\bar g = (\frac{1}{n}\sum_{i=1}^n z_i \epsilon_i)\)。
因此用样本估计估计总体估计时, 我们假设在大样本的情况下,
\(S_{ZX}^{-1} \bar g \xrightarrow{大样本} E(S_{ZX}^{-1} \bar g) = E(S_{ZX}^{-1})E(\bar g) = E(S_{ZX}^{-1}) \cdot 0 = 0\)
注意这里\(E(S_{ZX}^{-1})\)是一个数,所以可以分离。
所以\(E(\hat \beta - \beta) = 0 \to E(\hat \beta) = \beta\)
\[\begin{alignat}{2} Avar(\hat \beta) &= E((\hat \beta - \beta)^2)\\ &=E((S_{ZX}^{-1} \bar g)^2)\\ \cdots \end{alignat}\]
这里有比较简单的推导方法。
第一个方程是 \[\begin{alignat}{2} x &\sim z\\ \hat \gamma &= (z^{'}z)^{-1}z^{'}x\\ \hat x &= z \hat \gamma\\ &=z[(z^{'}z)^{-1}z^{'}x]\\ &=[z(z^{'}z)^{-1}z^{'}]x &=px\\ \end{alignat}\]
同理 \[\begin{alignat}{2} \hat \beta &= (\hat x \hat x)^{-1}\hat x y\\ \hat \beta &= (x^{'}P^{'}Px)^{-1}\hat x y\\ \hat \beta &= (x^{'}Px)^{-1}\hat x y\\ \hat \beta &= (x^{'}\hat x)^{-1}\hat x y\\ \hat \beta &= (zx)^{-1}zy\\ \end{alignat}\]
full rank 就是矩估计的条件
能够作为工具变量的变量数量不能少于内生变量的数量。
弱工具变量检验
Shea’s partial \(R^2\)
假设\(y = x_1^{'} \beta_1 + x_2 \beta_2 + \mu\),其中只有\(x_2\)是内生的,工具变量为\(z_2\)。 做回归 \(x_2 \sim x_1^{'} \to e_1\)和\(z_2 \sim x_1^{'} \to e_2\)。 其中\(e_1\)和\(e_2\)分别衡量了\(x_2\)和\(z_2\)除了\(x_1^{'}\)以外的其他波动。 再做\(e_1 \sim e_2 \to R_p^2\),如果\(R_p^2\)大,说明不是弱工具变量。
过度识别检验
\(z\)的数量超过内生的\(x\)数量。 只有这样\(E(z\epsilon)=0\),否则不满足 因此,我们假设有K个\(x\),r个是内生的,\(z\)有 m个,因此回归,
\[\epsilon \sim x_1 + \cdots + x_{K-r} + z_1 + \cdots z_m + error\] 如果得到的\(R^2\)大,或者说\(nR^2\)比较于\(\Theta^2(m-r)\)而大的话,那么\(E(z\epsilon)=0\)的条件就不满足了。 因此要求\(R^2\)尽可能低,即P值要小。
GMM
GMM是过度识别的时候使用,因为\(n(x) < n(z)\)。 这个时候\(\frac{1}{n}\sum_{i=1}^n z_i(y_i-x^{'} \hat \beta)\)不能等于0了,无解,但是可以使其平方最小。
一步还是两步
一步是满足同方差假设的,所以还是用两步吧。
弱工具变量容易有偏
\[y = 1 + 2x + \mu\]
强工具变量
\[x = 0.5z + 0.2\mu + 0.1v\]
弱工具变量
\[x = 0.01z + 0.2\mu + 0.1v\]
library(tidyverse)
beta_cb1 <- 1:100
beta_cb2 <- 1:100
a <- data_frame(
  mu = rnorm(100),
  v  = rnorm(100),
  z  = rnorm(100)
)
## Warning: `data_frame()` is deprecated as of tibble 1.1.0.
## Please use `tibble()` instead.
## This warning is displayed once every 8 hours.
## Call `lifecycle::last_warnings()` to see where this warning was generated.for (i in 1:100){
b <-
as.data.frame(resample_bootstrap(a)) %>%
mutate(
x1 = 0.5*z + 0.2*mu + 0.1*v,
x2 = 0.01*z + 0.2*mu + 0.1*v,
y1 = 1 + 2*x1 + mu,
y2 = 1 + 2*x2 + mu
) %>%
summarise(
beta1 = sum(z*y1)/sum(z*x1),
beta2 = sum(z*y2)/sum(z*x2)
)
beta_cb1[i] <- b[1,1]
beta_cb2[i] <- b[1,2]
}
data_frame(
beta1 = beta_cb1 %>% unlist(),
beta2 = beta_cb2 %>% unlist()
) %>%
gather() %>%
ggplot(aes(x = value, y = ..density..,col = key)) +
geom_freqpoly() +
labs(
x = "预测的beta值,真实为2",
y = "频率",
subtitle = "弱工具变量在小样本下很容易不对称,有偏",
title = "弱工具变量比较"
) +
theme_minimal() +
theme(text = element_text(family = "STKaiti"))## `stat_bin()` using `bins = 30`. Pick better value with `binwidth`.## Warning in grid.Call(C_stringMetric, as.graphicsAnnot(x$label)): Windows字体数据
## 库里没有这样的字体系列## Warning in grid.Call(C_stringMetric, as.graphicsAnnot(x$label)): Windows字体数据
## 库里没有这样的字体系列## Warning in grid.Call(C_textBounds, as.graphicsAnnot(x$label), x$x, x$y, :
## Windows字体数据库里没有这样的字体系列## Warning in grid.Call(C_stringMetric, as.graphicsAnnot(x$label)): Windows字体数据
## 库里没有这样的字体系列## Warning in grid.Call(C_textBounds, as.graphicsAnnot(x$label), x$x, x$y, :
## Windows字体数据库里没有这样的字体系列
## Warning in grid.Call(C_textBounds, as.graphicsAnnot(x$label), x$x, x$y, :
## Windows字体数据库里没有这样的字体系列
## Warning in grid.Call(C_textBounds, as.graphicsAnnot(x$label), x$x, x$y, :
## Windows字体数据库里没有这样的字体系列

## Warning in grid.Call(C_textBounds, as.graphicsAnnot(x$label), x$x, x$y, :
## Windows字体数据库里没有这样的字体系列

## Warning in grid.Call(C_textBounds, as.graphicsAnnot(x$label), x$x, x$y, :
## Windows字体数据库里没有这样的字体系列

## Warning in grid.Call(C_textBounds, as.graphicsAnnot(x$label), x$x, x$y, :
## Windows字体数据库里没有这样的字体系列
## Warning in grid.Call(C_textBounds, as.graphicsAnnot(x$label), x$x, x$y, :
## Windows字体数据库里没有这样的字体系列
## Warning in grid.Call(C_textBounds, as.graphicsAnnot(x$label), x$x, x$y, :
## Windows字体数据库里没有这样的字体系列
## Warning in grid.Call(C_textBounds, as.graphicsAnnot(x$label), x$x, x$y, :
## Windows字体数据库里没有这样的字体系列
## Warning in grid.Call(C_textBounds, as.graphicsAnnot(x$label), x$x, x$y, :
## Windows字体数据库里没有这样的字体系列
## Warning in grid.Call(C_textBounds, as.graphicsAnnot(x$label), x$x, x$y, :
## Windows字体数据库里没有这样的字体系列## Warning in grid.Call.graphics(C_text, as.graphicsAnnot(x$label), x$x, x$y, :
## Windows字体数据库里没有这样的字体系列## Warning in grid.Call(C_textBounds, as.graphicsAnnot(x$label), x$x, x$y, :
## Windows字体数据库里没有这样的字体系列
## Warning in grid.Call(C_textBounds, as.graphicsAnnot(x$label), x$x, x$y, :
## Windows字体数据库里没有这样的字体系列
## Warning in grid.Call(C_textBounds, as.graphicsAnnot(x$label), x$x, x$y, :
## Windows字体数据库里没有这样的字体系列
## Warning in grid.Call(C_textBounds, as.graphicsAnnot(x$label), x$x, x$y, :
## Windows字体数据库里没有这样的字体系列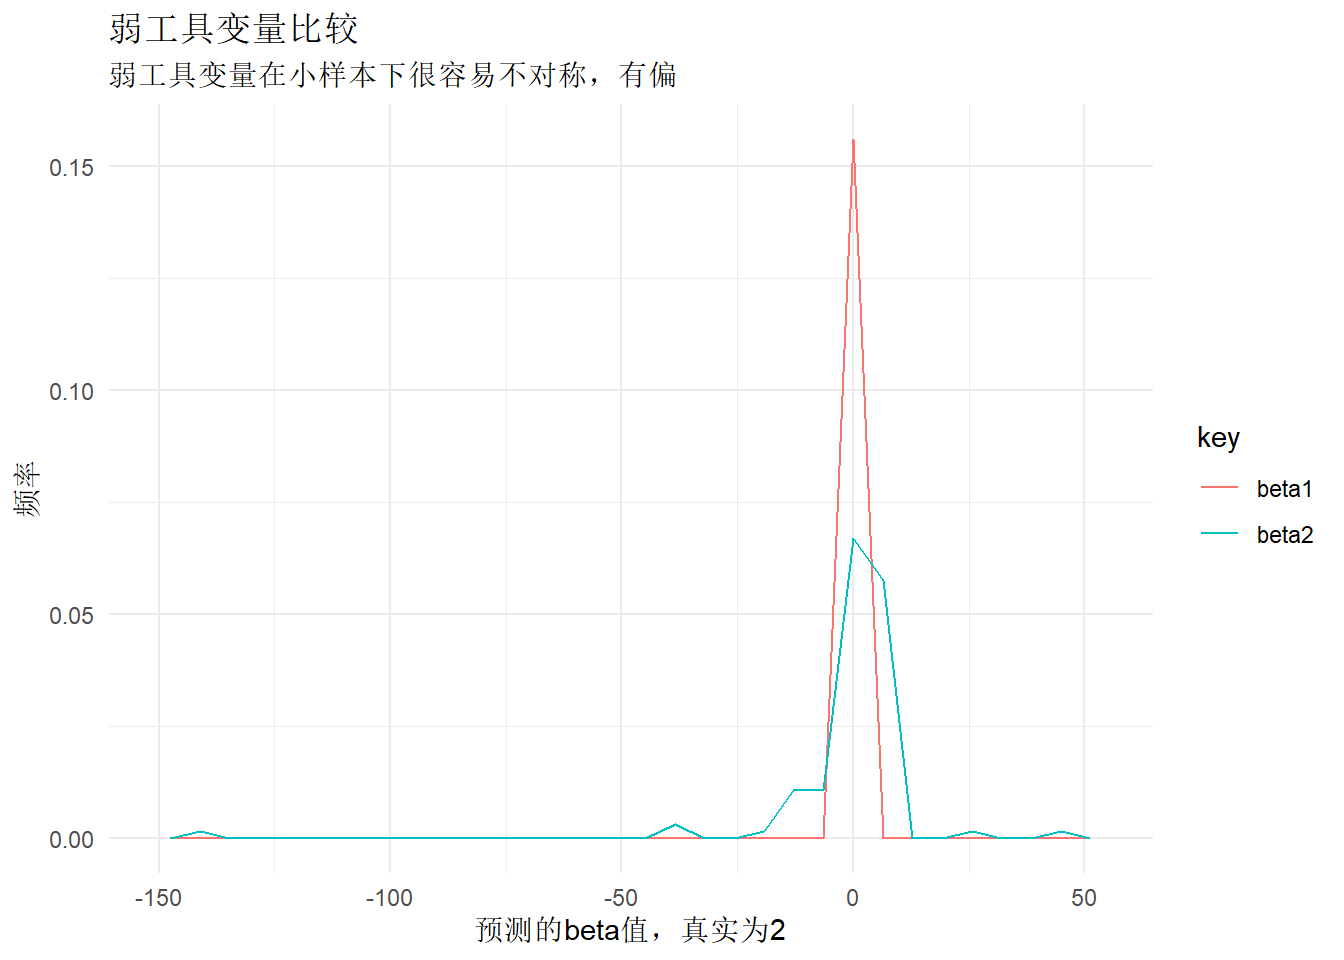
陈强. 2014. 高级计量经济学及Stata应用.第2版. 高等教育出版社.