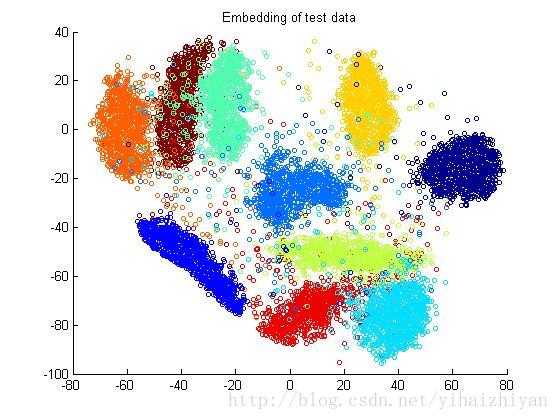
t-SNE = “t-distributed stochastic neighbor embedding” 这是t-SNE的全称,主要用于高维数据可视化。高维数据,表示一个用户数据,可以用10个、100个维度去描述,也就是特征多,这个时候,为了跟业务部门展示数据的分类, t-SNE就发挥了这样的作用。
这个图可以感受一下,

Python中,
from sklearn.manifold import TSNE引入。
.fit_transform,
simultaneously fits the model and transforms the data,
Can’t extend the map to include new data samples.
learning_rate=100,
try values between 50 and 200
徐志强: t-sne是流行学习的一种,属于非线性降维的一种,主要是保证高维空间中相似的数据点在低维空间中尽量挨得近。是从sne演化而来,sne中用高斯分布衡量高维和地位空间数据点之间的相似性,t-sne主要是为了解决sne中的“拥挤问题”,用t分布定义低维空间低维空间中点的相似性。但是t-sne不能算是一种通用的降维方法吧,时间复杂度也挺高的。
from sklearn.manifold import TSNE引入。1
# Import TSNE
from sklearn.manifold import TSNE

# Create a TSNE instance: model
model = TSNE(learning_rate = 200)

# Apply fit_transform to samples: tsne_features
tsne_features = model.fit_transform(samples)

# Select the 0th feature: xs
xs = tsne_features[:,0]

# Select the 1st feature: ys
ys = tsne_features[:,1]

# Scatter plot, coloring by variety_numbers
plt.scatter(xs, ys, c = variety_numbers)
plt.show()其中tsne_features是产生的一个\(N \times 2\)向量。
In [4]: tsne_features.shape
Out[4]: (210, 2)# Import TSNE
from sklearn.manifold import TSNE
# Create a TSNE instance: model
model = TSNE(learning_rate = 50)
# Apply fit_transform to normalized_movements: tsne_features
tsne_features = model.fit_transform(normalized_movements)
# Select the 0th feature: xs
xs = tsne_features[:,0]
# Select the 1th feature: ys
ys = tsne_features[:,1]
# Scatter plot
plt.scatter(xs, ys, alpha=0.5)
# Annotate the points
for x, y, company in zip(xs, ys, companies):
plt.annotate(company, (x, y), fontsize=5, alpha=0.75)
plt.show()相似的变量靠的近。
我想,肯定最后能看哪个影响比较大,只是暂时我代码不知道怎么写。 而且我看了下知乎,这个东西似乎大家只是用来做聚类,就是做分类的。 今天我刚刚看到,要是这个能看影响排序,就真的厉害了!!!
变量显著性
- t-SNE 不像逻辑回归和树模型那种,给出信息增益和显著性,只是为了提高预测能力。
- 有一个简单的方法来看变量的显著性,
- t-SNE出来后,不是会分类吗?
- 直接用这个预测值的分类的WOE,就知道那些变量显著不显著了。
manifold vt. 复写,复印;使……多样化;增多↩